
 Available in US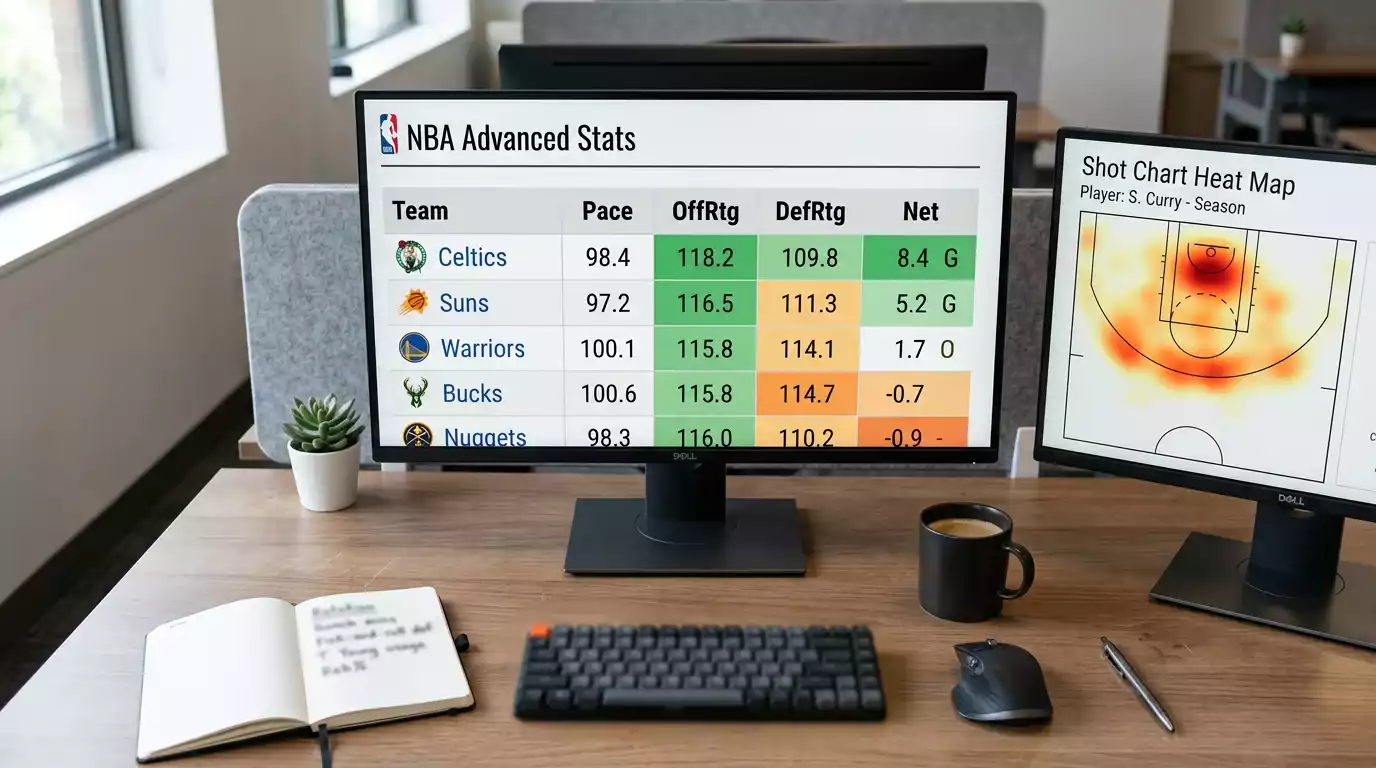
For the first year I bet NBA games, I used box-score stats: points, rebounds, assists. My model was built on the same numbers you’d see in a postgame recap. Then I switched to pace-adjusted efficiency metrics — offensive rating, defensive rating, net rating — and my model’s accuracy improved by about 3% overnight. That 3% doesn’t sound dramatic, but in a market where 1-2% separates profitable from unprofitable, it was transformational.
Advanced analytics in the NBA aren’t some secret tool locked behind expensive paywalls. The NBA’s official statistics portal provides pace, efficiency, usage rate, true shooting percentage, and net rating for every team and player — for free. Sportsbooks use these same metrics (plus proprietary data) to set their lines. If you’re betting without incorporating advanced stats into your analysis, you’re bringing a box score to a fight where the sportsbook has a full statistical laboratory.
The Metrics That Matter: Pace, Offensive Rating, Usage, and Net Rating
Pace measures possessions per 48 minutes and is the foundation of everything else. Raw points per game are meaningless without knowing how many possessions produced those points. A team averaging 110 points at 105 possessions per game is less efficient than a team averaging 108 points at 98 possessions. The second team scores more per opportunity, and per-opportunity efficiency is what predicts future performance — not raw totals.
Research tracking player performance across games documented an effect size of -1.27 from the first to the fourth quarter, confirming that pace isn’t just an offensive variable — it interacts with fatigue. Faster-paced teams burn more energy, which accelerates the fourth-quarter drop-off. When I project game totals, I adjust for pace-fatigue interaction: high-pace matchups produce more first-half scoring but converge toward league average in the fourth quarter as both teams tire.
Offensive and defensive rating — points scored or allowed per 100 possessions — isolate efficiency from volume. A team’s offensive rating tells you how well they convert each possession into points, regardless of how many possessions they play. Defensive rating tells you how effectively they prevent scoring per possession. Net rating (offensive minus defensive) is the single most predictive team metric for point spread handicapping. A team with a +5 net rating is expected to outscore opponents by about 5 points per 100 possessions, which translates directly into projected margins for spread betting.
Usage rate measures the percentage of team possessions a player uses while on the floor — through field goal attempts, free throw attempts, or turnovers. High-usage players (30%+ usage) are the primary drivers of team outcomes and the most important variables for player prop analysis. When a 32% usage player sits out, those possessions redistribute across the remaining roster in predictable patterns. Understanding usage redistribution is how I identify secondary player prop value after injury announcements — the same approach that has produced win rates above 60% on specific prop categories this season.
How Advanced Stats Inform Player Prop Selection
Block props hit at 69.9% on overs, three-point props at 63.2%, and steal props at 61.9% across more than 10,580 graded predictions this season. Those win rates aren’t generated by gut feeling — they’re the output of models that process advanced stats to identify where sportsbook prop lines are mispriced relative to matchup-specific projections.
The connection between advanced stats and prop edges is mechanical. A player’s scoring prop is a function of his usage rate multiplied by the expected possessions in the game multiplied by his scoring efficiency. If you project more possessions (a pace-up matchup) or higher usage (a teammate is injured), the scoring projection increases — possibly above the sportsbook’s line. The same logic applies to rebounds (rebounding rate times missed shots, which depends on pace and shooting efficiency of both teams) and assists (assist rate times made baskets by teammates).
Matchup-level analytics push this further. A center whose blocks prop is set at 1.5 might normally average 1.3 blocks per game. But against a team that ranks bottom-five in three-point rate and top-five in drives to the basket, his block opportunities increase dramatically. The sportsbook’s line reflects his season average, not the matchup-specific projection. That gap — between season average and matchup-adjusted expectation — is where prop value lives.
I use a three-step process for prop selection. First, calculate the player’s base projection using usage rate, pace, and efficiency. Second, adjust for the specific matchup using opponent defensive tendencies and positional data. Third, compare the adjusted projection to the sportsbook line. If the gap exceeds 10% of the line value (e.g., my projection is 1.8 blocks versus a line of 1.5), I consider it a play. Below 10%, the edge is too thin to overcome the vig reliably.
Free and Paid Advanced Analytics Sources for NBA Bettors
The good news: the data you need for serious NBA betting analysis is largely free. The NBA’s official statistics site provides per-game, per-36-minute, per-100-possession, and advanced stat tables for every player and team. Basketball Reference offers historical data going back decades, including on/off splits, lineup data, and shooting charts. Cleaning the Glass provides pace-adjusted numbers in clean, sortable formats.
Free data has limitations. Lineup-combination efficiency, real-time tracking data (player movement, shot contest distances), and play-type frequency data require either paid subscriptions or scraping from multiple sources. Services that provide this level of detail — synergy-style play-type breakdowns, tracking camera data, and matchup-filtered statistics — run from $20-$50 per month, which is a reasonable investment for anyone betting more than a few hundred dollars per month on NBA games.
The most underutilized free resource is the NBA’s own play-by-play data, which can be processed into custom metrics with basic programming skills. Want to know how a team’s defensive efficiency changes in the fourth quarter specifically? The play-by-play data lets you calculate it. Want to measure a player’s scoring rate in pick-and-roll situations against drop coverage? The play-type data reveals it. The bettors who extract custom metrics from raw play-by-play data have an informational edge over those who rely on pre-packaged stats, even when the raw data is freely available to everyone.
Advanced analytics aren’t a magic bullet. A model built on advanced stats can still lose money if the bankroll management is sloppy, the bet selection is undisciplined, or the market has already priced in the same information. But analytics are the prerequisite for competing in a market where the sportsbook’s line-setting model uses the same (and more) data. Bringing a box score to that fight means losing before you start.
